4212 W Desert Cove Ave, Phoenix, AZ 85029  
 
Beds/Baths: 3/2
Bedrooms Plus: 5
Approx SqFt: 1,356 (County Assessor)
Year Built: 1968
Pool: Yes
Encoded Features: N/A
Approx Lot SqFt: 7,520 / County Assessor
Apx Lot Size Range:
Exterior Stories: 1
# of Interior Levels: 1
Furnished?: Unfurnished
Dwelling Styles: Detached
Vacation Rental Y/N: N
Date Available: N/A
Subdivision: 
Tax Municipality: Phoenix
Marketing Name:
Planned Cmty Name: 
Model:
Builder Name: unknown
Hun Block:
Map Code/Grid: J35
Bldg Number:
Ele Sch Dist: 069 – Paradise Valley Unified District
Elementary School: Boulder Creek Elementary School – Phoenix
Jr. High School: Mountain Trail Middle School
High School Dist #: 069 – Paradise Valley Unified District
High School: Pinnacle High School


Public Remarks:

4212 W Desert Cove Ave is a house in Phoenix, AZ 85029. This 1,356 square foot house sits on a 7,585 square foot lot and features 2 bathrooms. This property was built in 1972 and last sold for $116,360. We estimate the home’s value is now $187,718, which is 61.3% more than when it was last sold. Comparable nearby homes include 10411 N 43RD Ave, 4443 W MERCER Ln, and 4339 W SHANGRI LA Rd.

Nearby schools include Arizona Montessori Charter School – Glendale, North Pointe Preparatory School and Abraham Lincoln Traditional School. The closest grocery stores are Twice the Ice, Charm Rice Co and 99 Cents Only Stores. Nearby coffee shops include Starbucks, Ronnie’s Cafe and Starbucks. Nearby restaurants include Cuban Foods Bakery & Restaurant, Jack In the Box and Denny’s. 4212 W Desert Cove Ave is near Surrey Park, City Of Phoenix/ ASU West Community Park and Arizona State University – West. There are excellent bike lanes and the terrain is flat as a pancake. 4212 W Desert Cove Ave is very bikeable, biking is convenient for most trips. This address can also be written as 4212 West Desert Cove Avenue, Phoenix, Arizona 85029.

Cross Street: Cave Creek Road / Desert Peak Road Directions: North on Cave Creek Road, West on Desert Peak to Misty Willow Lane. Turn left and proceed to 23rd street. Turn right on 23rd street and then right on Dry Wood Rd. House on right.

Features

Room Details Construction & Utilities Tax & Lease Information
Approx SqFt Range: 964 Sq. Ft.
Features:
Fireplace:
No Fireplace
Garage Spaces: 0
Carport Spaces: 1
Total Covered Spaces: 1
Slab Parking Spaces: 1
Parking Features: none
Pool – Private: Pool – Community
Spa – Private:
Horses: N
Property Description: Flat
Landscaping: Gravel/Stone Front; Gravel/Stone Back;
Exterior Features: 2-Covered Patio(s);
Technology: Cable Avail
Energy/Green Feature: Ceiling Fan(s)
Windows: Dual Pane; Low-E; Wood Frame
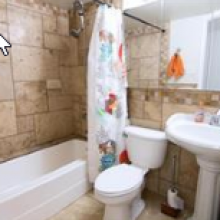
Kitchen Features: Range/Oven Elec; Cook Top ; Disposal; Dishwasher; Built-in Microwave; Refrigerator; Wall Oven(s); Walk-in Pantry; Granite Countertops;
Master Bathroom: Shwr & Tub; Double Sinks; Private Toilet Room; Walk-in Shower
Master Bedroom: Split
Additional Bedroom:
Laundry: Washer Included; Dryer Included
Dining Area: Formal; Breakfast Bar
Basement Y/N:N
Sep Den/Office Y/N: N
Other Rooms: Family Room;
Window Coverings: Drapes; Blinds
Flooring: Carpet; Tile;
Const – Finish: Painted
Construction: Frame – Block
Roofing: Asphalt Shingle
Fencing: Chain Link
Cooling: Refrigeration, Ceiling Fans; Roof Vents
Heating: Gas Heat
Utilities: APS; SW Gas
Water: City Water
Sewer: Sewer – Public
Services: City Services
County Code: Maricopa
AN: 141-47-338
Legal Subdivision: Dreamland Villa 8
Lot Number: 811
Town-Range-Section: 14-1N-6E
Census Tract: 040134202.093002
Rent Payable:
Owner
Possession (Rentals): Immediate
Disclosures: Agency Discl Req
Forms Required: AAR Lease; Credit Report Other
Rent Includes: N/A
Lease Information: 12 Month Minimum
Pets: Lessor Approval

Tax and Assessed Values

YEAR PROPERTY TAXES CHANGE TAX ASSESSMENT CHANGE
2017 $1,028 +8.0% $11,680
2016 $952 -2.9% $11,680 +3.4%
2015 $981 $11,300 +58.9%
2014 $7,110 +39.4%
2013 $5,100 -18.0%
2012 $6,220 -13.6%
2011 $7,200 -24.2%
2010 $9,500 -38.4%
2009 $15,430 -11.3%
2008 $17,400 +21.3%
2007 $14,350 +47.2%
2006 $9,750
2005 $9,750 +16.8%
2004 $8,350
2003 $8,350 +11.3%
2002 $7,500

Aeral Map

Birdseye View

Flood Map

This map layer shows an area’s flood zone des ignation as determined by the Federal Emergency Management Agency (FEMA). A high-risk area has a 1 percent or greater annual chance of flooding and a 26 percent chance of flooding over the life of a 30-year mortgage. H igh-risk areas are red or orange. The coas t areas , shown in purple, are also cons idered high risk . Green areas are low to moderate risk . A moderate-risk area is between risk limits of a 100-year and 500-year flood. White areas are undetermined, and all other areas are cons idered no or low risk . For more details on the categories of flood risk , see http://support.narrpr.com/entries /319901-what-is-the-flood-zone-heat-map. Source(s): FEMA; updated Annually.

Comps:

Market Trends: